Scaling a hand-built map workflow
Tech Relays replaced The Cruise Maps' fragmented, manual workflow with an integrated map production system, increasing output by 140% and cutting errors by 20%.
What they needed
The Cruise Maps is a UK-based business that produces personalised cruise maps for customers, using shipping data to plot each voyage's exact route and print-on-demand facilities to manufacture and distribute physical copies worldwide. The business processes thousands of orders per month and came to Tech Relays to build an integrated production system capable of keeping pace with demand.
The Cruise Maps team had built their production workflow around Python workbooks running in Anaconda and a basic HTML/JS application, supported by specialist contractors with maritime expertise, with no integration between any of these components. Processing each order required the team to manually extract voyage details from Shopify into the workbooks, then transcribe them again into the HTML/JS application before a map could be produced. Both handoffs introduced errors, and with no automated checks in place, mistakes routinely reached the finished print. The team could produce an average of 15 to 20 maps per day.
What we built
Tech Relays began with a discovery workshop to understand the business goals, the production bottlenecks, and the maritime domain. From there, the teams defined requirements and mapped the data flow across the three systems: the Shopify eCommerce platform, the Spire AIS shipping data supplier, and the print-on-demand fulfilment company.
The core of the system was a Python API connected to Shopify's Admin API via GraphQL webhooks, receiving a notification each time a customer placed an order. This triggered a geo-processing pipeline against the Spire AIS positional data for that voyage: the raw track was sampled to a workable density, checked for intersections with land polygons (a common artefact in AIS data where signal noise can place a vessel onshore), and assessed for sufficient data coverage to produce a satisfactory map. The pipeline also checked whether the same voyage had been ordered before; where a curated track already existed, the system reused it rather than reprocessing from scratch. Validated tracks entered a review queue for the mapping team.
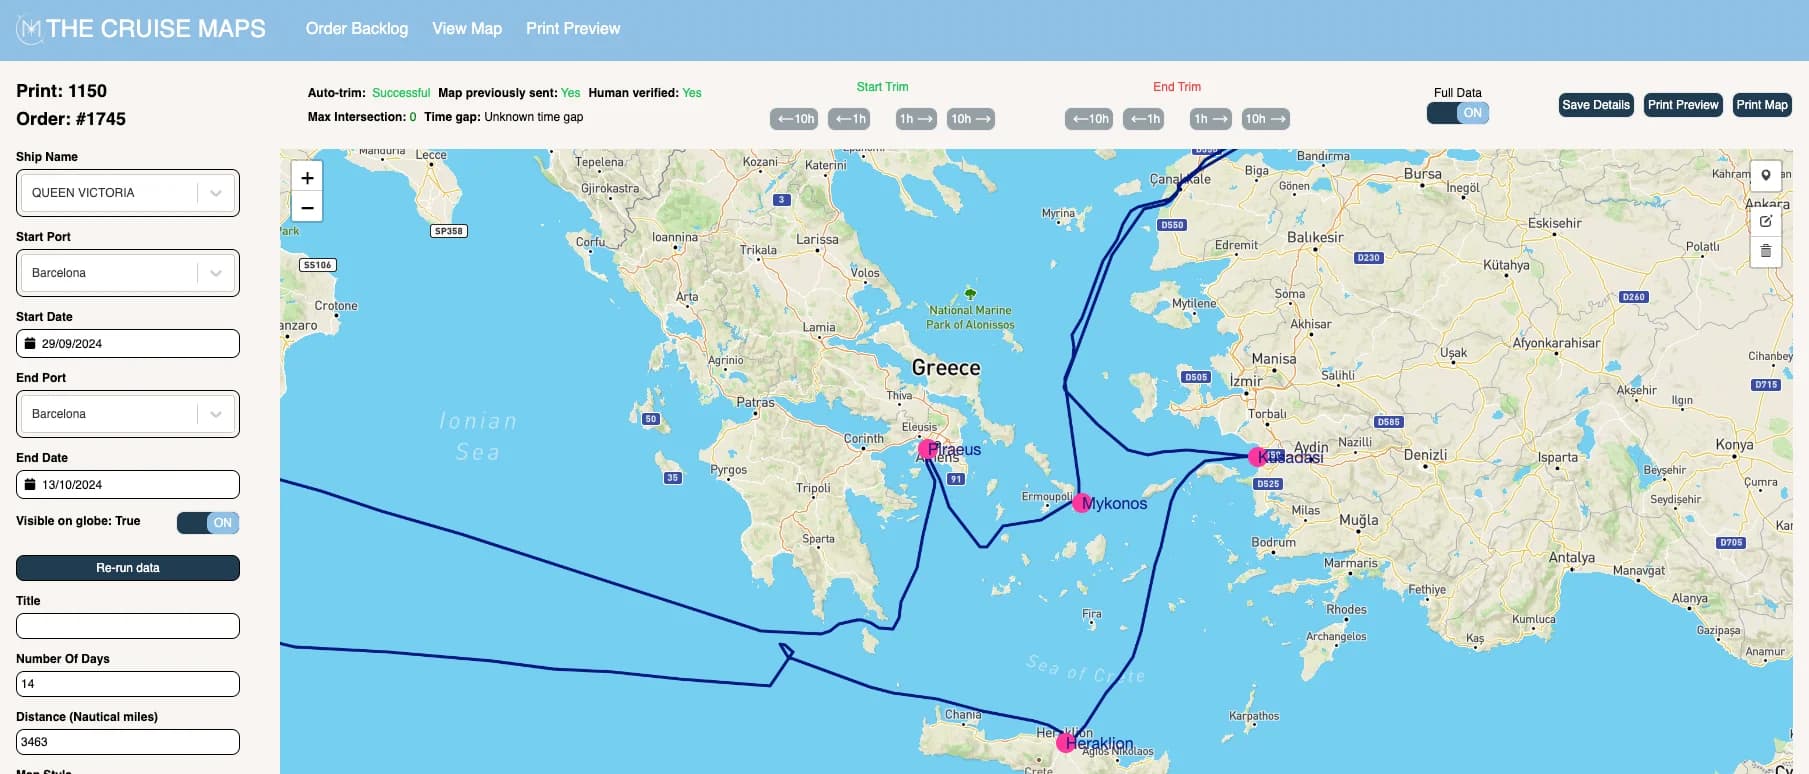
That review took place in a React application built with Mapbox and Leaflet, which gave mappers a clear view of the processed track before it was committed to print. From the dashboard, the mapper selected one of around 15 style configurations, made any final adjustments, and approved the order for production. The system then dispatched the job to one of two print-on-demand suppliers via their respective APIs, listened for delivery confirmation, and wrote the fulfilment status back to Shopify automatically.
A key challenge was ensuring the mapping team could control the appearance of maps without requiring development time from Tech Relays for every new style or co-branded variant. The solution was a set of JSON configuration files stored on S3, one per style, which the mapping team could select and edit directly. These gave mappers direct control over everything from port call colours to cruise line co-branding, without requiring a development release for each new variant.
What we delivered
The Nautical Mapper production system increased The Cruise Maps' output by 140% whilst reducing printing and data errors by 20%. Automating the two manual transcription steps removed the primary source of errors in the workflow.
The 140% output increase understates the broader commercial impact. Before Nautical Mapper, a single operator's daily capacity set the ceiling on production, not demand. With the automated pipeline and dashboard in place, The Cruise Maps built out a dedicated production team in the Philippines, scaling the operation to a volume the previous workflow could not have supported regardless of how many people were added to it.
The JSON style configuration files gave the mapping team the ability to develop new styles and co-branded map variants without engineering involvement at each step. The Cruise Maps now offers around 15 distinct printable styles and has established a range of cruise line brand partnerships, neither of which would have been commercially viable under the previous workflow.
Shopify · Print-on-demand APIs · Shipping data integrations
140% more maps produced · 20% fewer errors across the board
“Tech Relays work hard to ensure you get what you want, but also advise you on industry best practices and cost saving opportunities — all while providing a high level of customer service and application support.”
— The Cruise Maps
Ready to build something?
Tell us about your project and we'll come back to you within 24 hours.
Let's Talk →